Finally we are here for Skull Engine v1.2.3, a special tag number, and a big story behind.
Let’s check how many important features since v1.1:
- New: Realtime memory tracing tool
skull-trace - New: Override libc malloc to better measure memory stats
- New: Upgrade python2 to python3
- Enhancement: Remove protobuf-c from Engine dependency
- Enhancement: Add
google/protobufas a submodule
The full change log please refer to here.
When we say “memory”, people usually think about memory pool, efficient memory allocation, garbage collection, but all the terms seem pretty old concepts, nowadays fewer people care about it since RAM is getting cheaper and cheaper. No enough RAM? Just upgrade it to a bigger one. Thus, it sounds like we can ignore the memory related issues, but can we?
The reality is, even today, the memory management is still a serious topic during the development cycle, whatever we have a faster GC, an efficient memory pool or a better programming language, to better manage memory is still not that easy.
In order to better manage it, we need a way to measure it first. So this time, let’s talk about memory measurement.
Experimental Memory Measurement
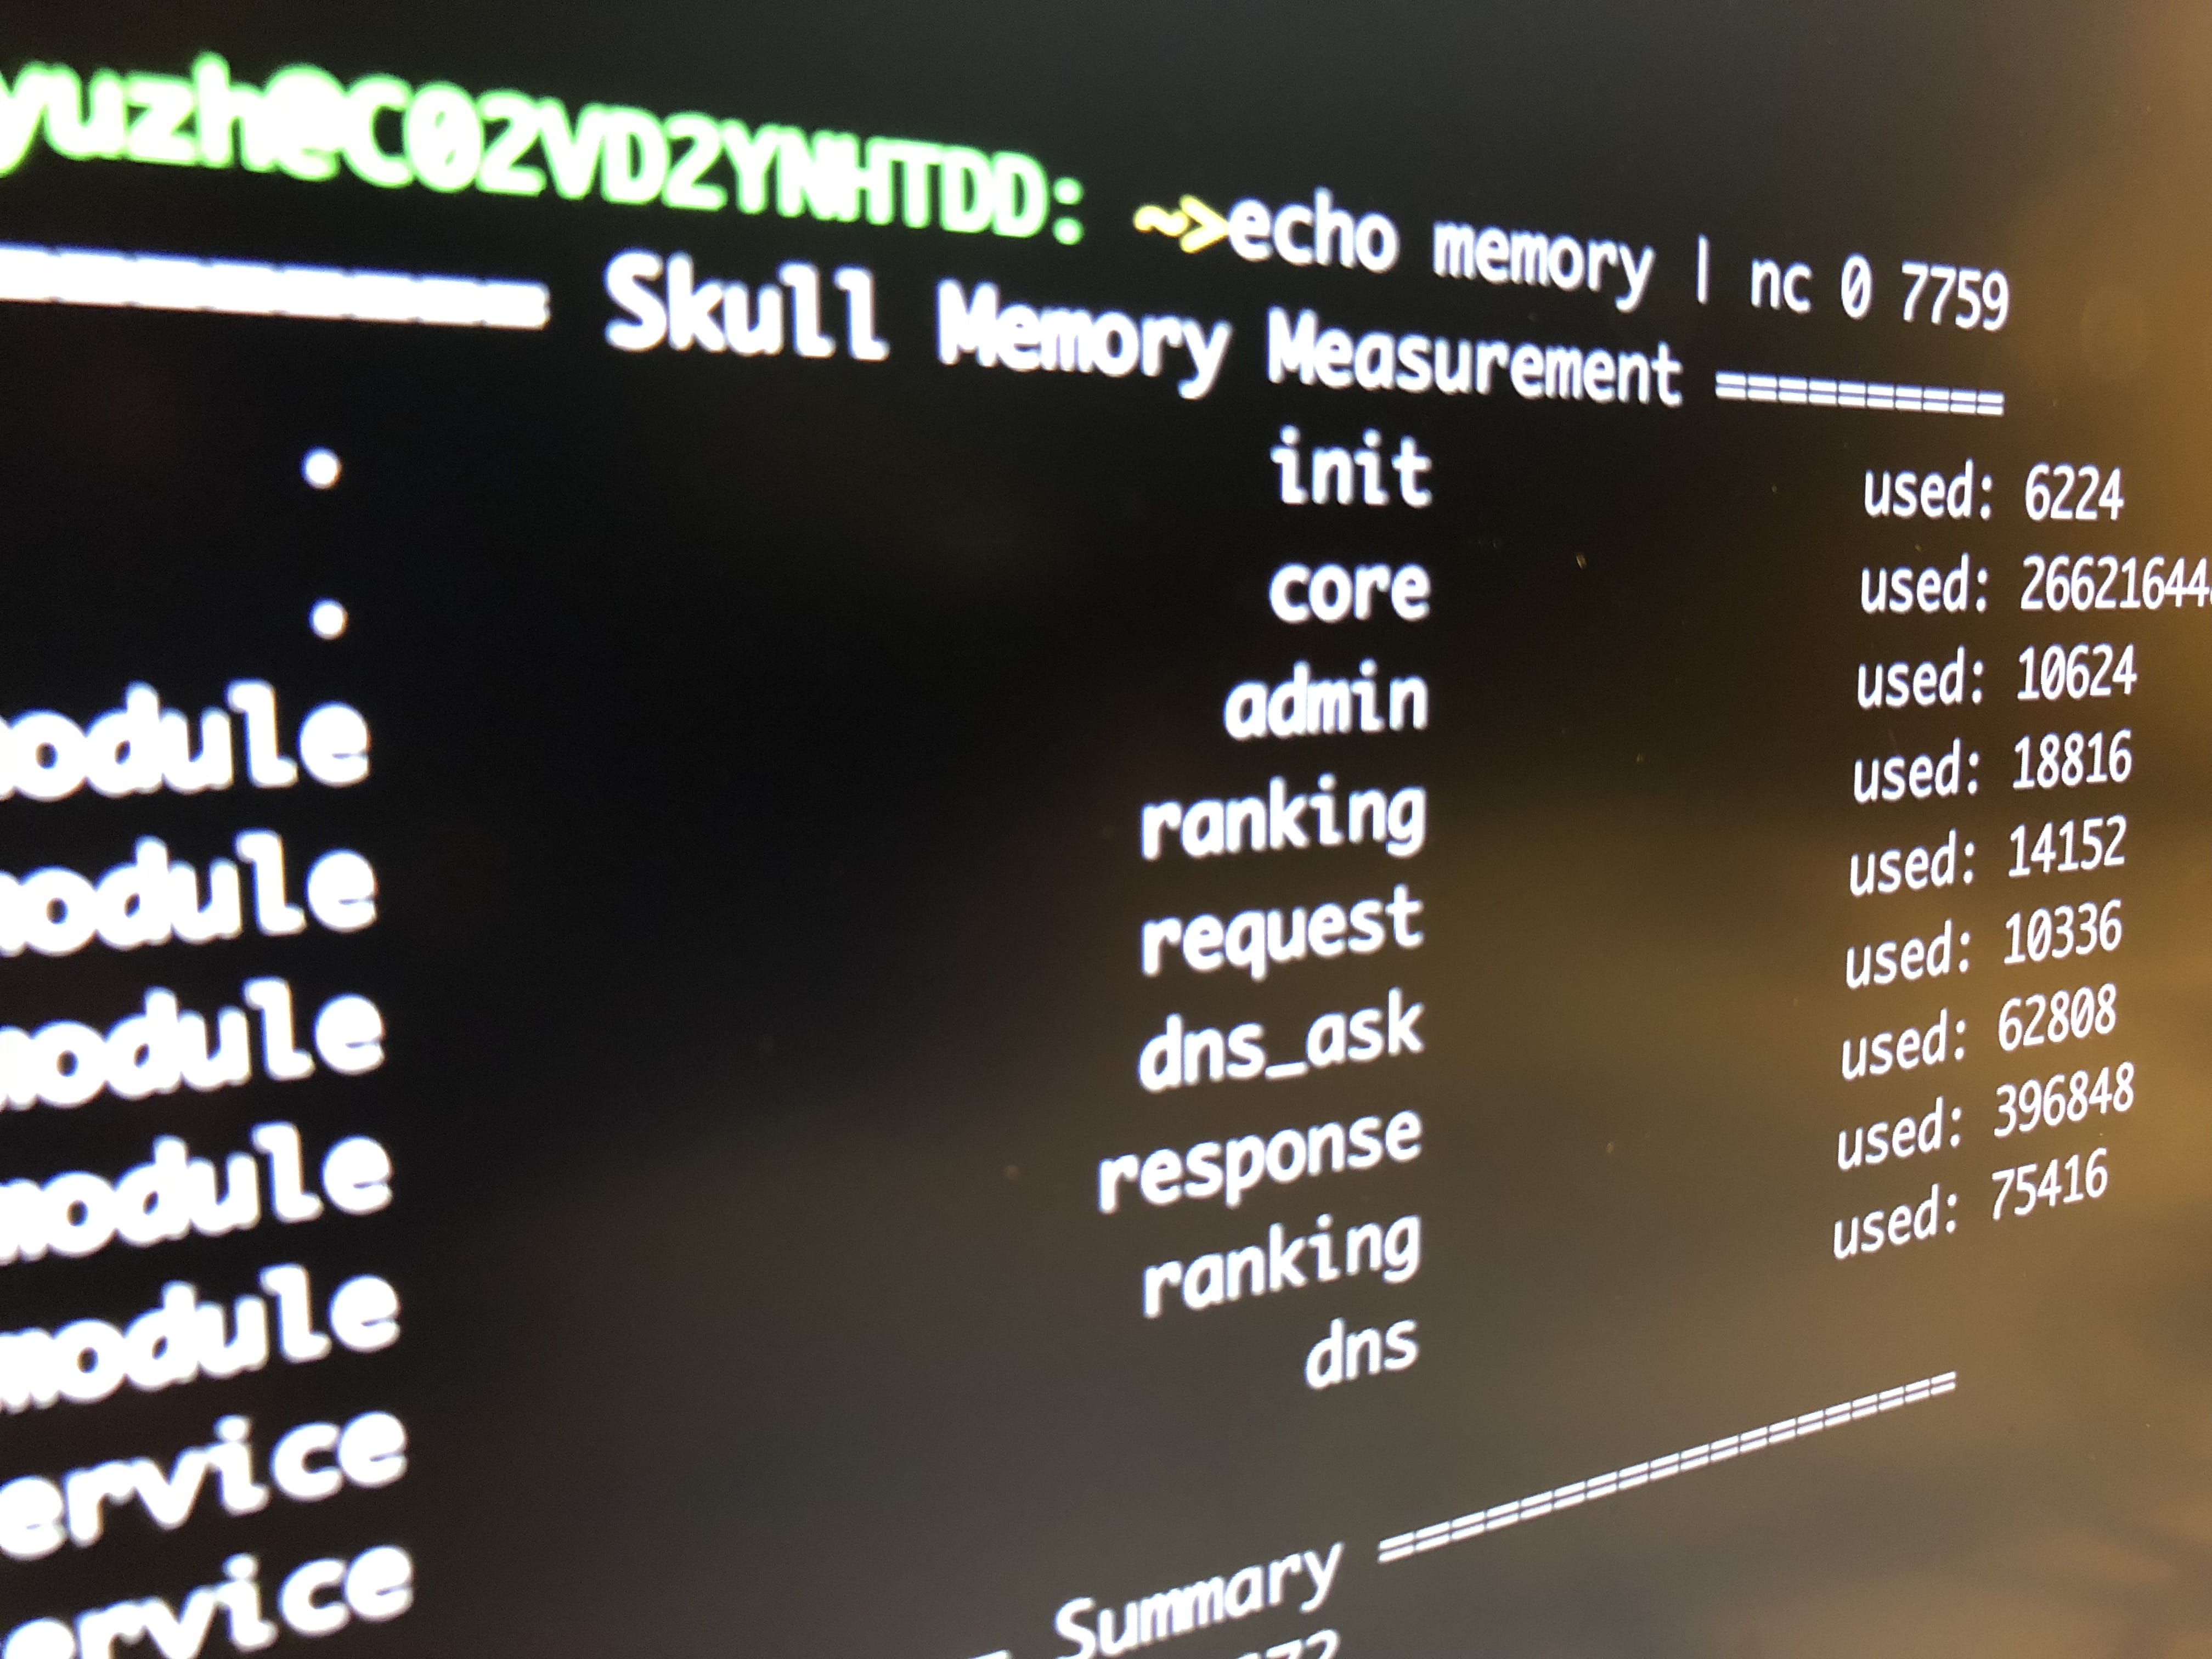
root@de925ca81ab4:/workspace# echo memory | nc 0 7759
======== Skull Memory Measurement ========
      .        init        used: 6184
      .        core        used: 274031720
 module       admin        used: 10624
 module     ranking        used: 0
 module     request        used: 0
 module     dns_ask        used: 0
 module    response        used: 0
service     ranking        used: 272
service         dns        used: 0

================ Summary =================
Total Allocated: 274048800
Trace Enabled: 0
Think about the normal feature releases, to better verify the feature is working or not, we may have different situations need to deal with, like:
- Exception in certain cases
- Crash
- Behavior changes
- Memory leak
For the first two cases, they usually fail at an early stage, we can fix them immediately with direct hints. But for the rest of the two, we need a strong monitoring/reporting mechanism to check it after a long run.
Here, for the last one Memory Leak, whatever which programming language we use, even today (someone may think there is no such kind of issue anymore), it is still possible to leak buckets of memory in somewhere. And usually we observe the total application memory utilization, if leak happens, hard to say which part could cause the leak, rollback is always the quickest action we can take, but in the next for the reproducing and fixing, it is still a headache, and there are some of the possible methods we can use:
- Review all the changes (May bunch of PRs): Low efficiency and may not find finally
- Binary Install PRs until locate which PR caused leak: Low efficiency and long duration
- Use Valgrind-like tool to reproduce and observe (For C/C++ program): Impossible in production, it’s too slow.
Above is a lucky situation we have, a terrible story is that we take over a project from others, and there are some leaks already, no one knows where it is. Keep restarting in certain cycles (hours/days) to avoid OOM is the first thing we can do at the beginning. There is no PRs we can review, just entire code base, so what can we do?
So, there is no clear signal to tell us which part of code caused leak, if there is, could be much easier for these kind of problems. That’s why this memory measurement feature be rollout, it provides per-module, per-service memory utilization monitoring, like ram usage, call times in different APIs(malloc, realloc, free). From it, we can directly knows about which component’s memory is keep increasing, and get back to the PR changes related to that component, to solve the issue faster than before.
And with this feature, we can also get more benefits, like, after every release or when we doing the A/B testing, we can compare with the old one to see whether the new code introduces too much memory, or whether the optimization for memory usage works or not, it’s now truly based on the data instead of imagination. And base on that, like I mentioned above, the measurement is not just a ram usage, it also provides the call times for each low-level API, so take that signal, we can either optimize how to reduce the memory pressure for a certain module/service, or reduce the call times for a hotspot code path, in order to ease the peak ram or GC pressure. Now with it, we can understand our application even better than ever.
For the details about how this feature was designed and implemented, the issues I handled, the trade-off I made, I’ll write another blog to describe, stay tuned :)
Low-level libc malloc tracing toolkit
By having above memory measurement feature, it would help people to locate the painful leak problem in a faster way, but it’s not enough, it is just a start. The next big problem is how we solve it? As we know, solve a leak issue would take a lot of efforts and time and get frustrated. After that, people may say “How stupid the problem is”…
Anyway, this part actually is case by case:
- If we locate the code changes which caused it, just fix it.
- If multiple PRs there, still can use binary-search mechanism to locate it.
Problem solved, cheers!
But wait… it’s not finished yet, to avoid the same issue happens again, we need a postmortem to fully understand why/when/how it happened. Let’s imagine it what we will do: we read a lot of related codes, carefully identify which part allocated memory and which part released them, and draw a flow, reverse checking all the stuffs that makes sense, then we get the conclusion.
Well, this is just a perfect example, the truth is, in most of the cases, people usually guess it intuitively, and explain it to others if it looks like making sense.
Let’s think it in another way, if we have a light-weight tracing system, the story will be totally different. Trace the system when we reproduce the problem, and from the trace log, we can exactly knows which allocation isn’t released after a well-defined scope. That means we fully understood the problem, and fixed it exactly.
So, it is the time to bring skull trace on the table, there are few goals before implementation:
- Light-weight which can be enabled in production
- On-demand realtime tracing
- Shows exact code with line number (If has symbol) instead of address
- Works well with ASLR enabled system
Below is a demo of the tracing output:
Last
Beyond those above, please also be open minded to think about few more questions:
- How to improve the system design by using memory measurement mechanism?
- What if a buffer allocated in layer A, but released in layer B?
- What if we want to split different layers into separate servers?
- Is that possible to detect a memory leak before release by leveraging tracing toolkit in a automated way?
OK, it’s enough for today, but the story is still ongoing. By measurement and tracing, there will be more interesting places for we to play. Stay tuned :)